
파일:500-mb pressure chart 2021-06-28 700EST Heat dome Pacific NW.png

미리 보기 크기: 800 × 600 픽셀 다른 해상도: 320 × 240 픽셀 | 640 × 480 픽셀 | 1,024 × 768 픽셀 | 1,040 × 780 픽셀
원본 파일 (1,040 × 780 픽셀, 파일 크기: 83 KB, MIME 종류: image/png)
파일 설명
| 설명 |
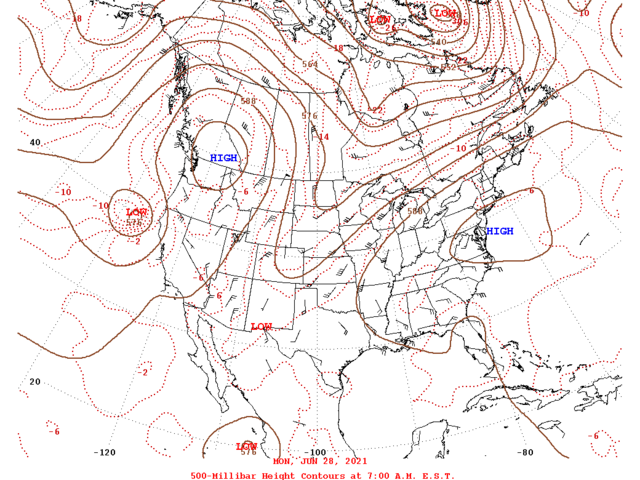
English: 500-mb pressure chart, valid 28 June 2021, 7:00 EST (11:00 UTC). The high pressure area centered over southern British Columbia is the cause of the heat dome, which led to the Pacific Northwest heat wave. Cropped for convenience. Geopotential height chart at 500 millibars at 11:00 UTC on June 28, 2021. The center of the heat dome, which caused the heat wave, can be seen over the British Columbia Interior. The heat dome of the 2021 Western North America heat wave, over west Canada and the Northwest United States. The "high" pressure at left is the heat dome.
Català: Situació d'un Bloc Rex sobre la Columbia Britànica.
Cymraeg: Geopotential height chart at 500 millibars at 11:00 UTC on June 28, 2021. Gweler ganolbwynt y gromen wres a achosodd y don-wres, yn sefyll dros berfeddwlad British Columbia.
Deutsch: 500 mb Karte der Hoch- und Tiefdruckgebiete in Nordamerika am 28. Juni 2021, 11:00 UTC.
Español: Carta meteorológica que muestra un bloqueo a 500 hPa y una cúpula de calor sobre el oeste de Canadá y los Estados Unidos en la ola de calor de junio de 2021.
Français : Carte météo montrant une circulation bloquée à 500 hPa et le dôme de chaleur en pointillé (rouge) sur l'ouest de l'Amérique du Nord en juin 2021. Situation d'un bloc Rex sur la Colombie-Britannique.
Italiano: La bolla di calore dell'ondata di caldo del Nord America occidentale del 2021, sul Canada occidentale e sugli Stati Uniti nordoccidentali . L'alta pressione è in corrispondenza della bolla di calore.
日本語: 6月28日時点の天気図。画像左側の高気圧によってヒートドームが生じている。.
Русский: Тепловой купол 2021 года в западной части Северной Америки, над западом Канады и Северо-западом Соединенных Штатов. «Высокое» давление — это тепловой купол.
ไทย: โดมความร้อนของคลื่นความร้อนในอเมริกาเหนือตะวันตกปี ค.ศ. 2021 เหนือผืนโลกบริเวณแคนาดาตะวันตกและสหรัฐอเมริกาตะวันตกเฉียงเหนือ ความกดอากาศ "สูง" (high - H) คือโดมความร้อน. |
| 날짜 | |
| 출처 | https://www.wpc.ncep.noaa.gov/dailywxmap/dwm_500ht_20210628.html |
| 저자 | 미국 해양대기청 |
라이선스
|
|
파일 역사
날짜/시간 링크를 클릭하면 해당 시간의 파일을 볼 수 있습니다.
| 날짜/시간 | 섬네일 | 크기 | 사용자 | 설명 | |
|---|---|---|---|---|---|
| 현재 | 2022년 8월 14일 (일) 23:31 | | 1,040 × 780 (83 KB) | Sebastian Wallroth | Uploaded a work by {{Label|Q214700}} from https://www.wpc.ncep.noaa.gov/dailywxmap/dwm_500ht_20210628.html with UploadWizard |
이 파일을 사용하는 문서
다음 문서 1개가 이 파일을 사용하고 있습니다:
이 파일을 사용하고 있는 모든 위키의 문서 목록
다음 위키에서 이 파일을 사용하고 있습니다:
- ar.wikipedia.org에서 이 파일을 사용하고 있는 문서 목록
- beta.wikiversity.org에서 이 파일을 사용하고 있는 문서 목록
- bn.wikipedia.org에서 이 파일을 사용하고 있는 문서 목록
- ca.wikipedia.org에서 이 파일을 사용하고 있는 문서 목록
- cy.wikipedia.org에서 이 파일을 사용하고 있는 문서 목록
- de.wikipedia.org에서 이 파일을 사용하고 있는 문서 목록
- en.wikipedia.org에서 이 파일을 사용하고 있는 문서 목록
- en.wikiversity.org에서 이 파일을 사용하고 있는 문서 목록
- es.wikipedia.org에서 이 파일을 사용하고 있는 문서 목록
- fr.wikipedia.org에서 이 파일을 사용하고 있는 문서 목록
- it.wikipedia.org에서 이 파일을 사용하고 있는 문서 목록
- ja.wikipedia.org에서 이 파일을 사용하고 있는 문서 목록
- ru.wikipedia.org에서 이 파일을 사용하고 있는 문서 목록
- th.wikipedia.org에서 이 파일을 사용하고 있는 문서 목록
- www.wikidata.org에서 이 파일을 사용하고 있는 문서 목록