
파일:Boston economy chart.png
최대 해상도입니다.
Boston_economy_chart.png (567 × 473 픽셀, 파일 크기: 42 KB, MIME 종류: image/png)
파일 설명
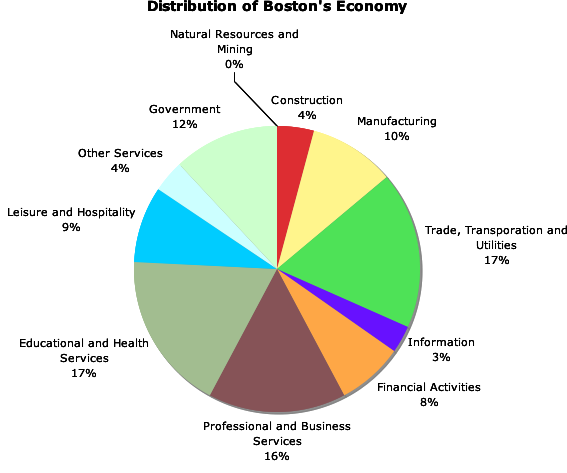
| 설명 | A pie chart made in w:Microsoft Excel demonstrating the distribution of the economy of w:Boston, Massachusetts. Data taken from [1]. |
| 날짜 | |
| 출처 | 자작 |
| 저자 | Admrboltz |
| 저작권 (이 파일을 인용하기) |
PD-Self |
라이선스
| 나는 이 작품의 저작권자로서, 이 작품을 퍼블릭 도메인으로 모두에게 공개합니다. 이 공개 선언은 전 세계적으로 유효합니다. 만약 저작권의 포기가 법률적으로 가능하지 않은 경우, 나는 이 작품을 법적으로 허용되는 한도 내에서 누구나 자유롭게 어떤 목적으로도 제한없이 사용할 수 있도록 허용합니다. |
파일 역사
날짜/시간 링크를 클릭하면 해당 시간의 파일을 볼 수 있습니다.
| 날짜/시간 | 섬네일 | 크기 | 사용자 | 설명 | |
|---|---|---|---|---|---|
| 현재 | 2007년 12월 27일 (목) 03:52 | | 567 × 473 (42 KB) | Admrboltz | Removing legend. |
| 2007년 12월 27일 (목) 03:49 |  | 702 × 438 (52 KB) | Admrboltz | {{Information |Description=A pie chart made in w:Microsoft Excel demonstrating the distribution of the economy of Boston, Massachusetts. Data taken from [http://www.city-data.com/us-cities/The-Northeast/Boston-Economy.html]. |Source=self-made |Dat |
이 파일을 사용하는 문서
다음 문서 1개가 이 파일을 사용하고 있습니다:
이 파일을 사용하고 있는 모든 위키의 문서 목록
다음 위키에서 이 파일을 사용하고 있습니다: